
 Property Market
11 May 2026
68 Days to Sell a Chelmsford Home… Unless You Get This Wrong
If you are a homeowner or landlord in Chelmsford and th…

Property Market
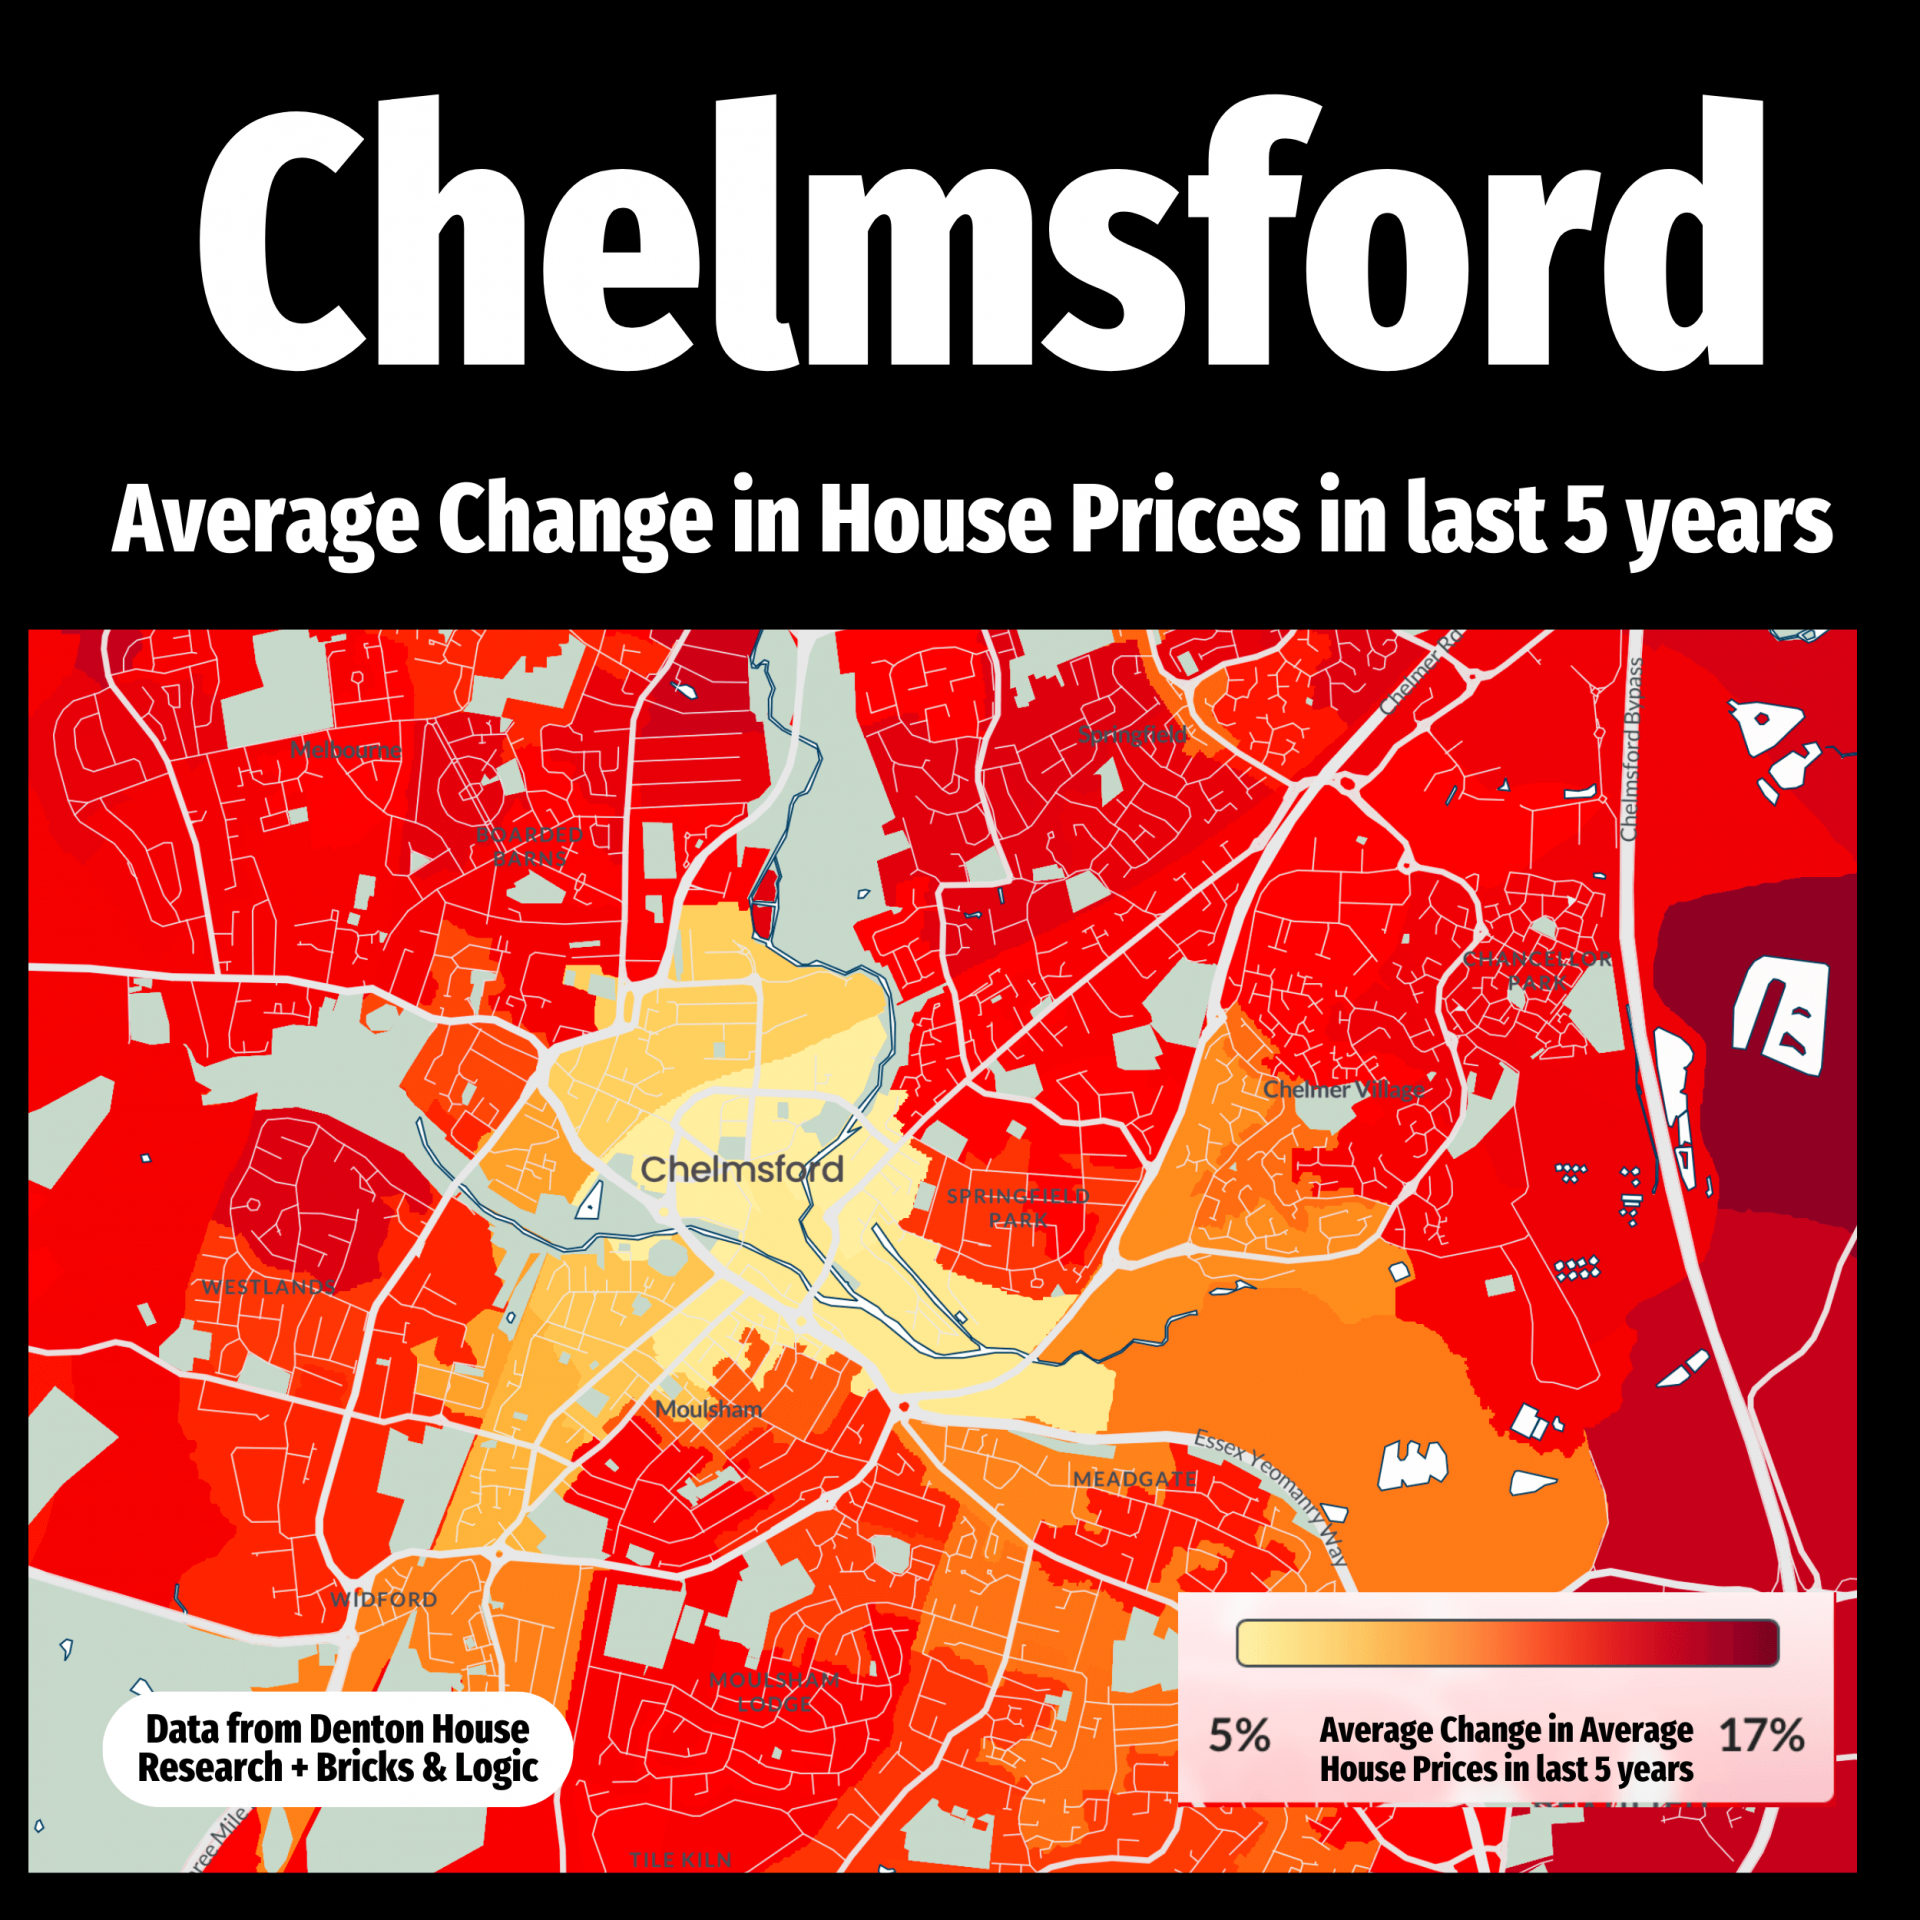
Chelmsford’s housing market has witnessed notable developments in the past five years, a period marked by evolving trends, a pandemic yet also opportunities. To capture and illustrate these changes, I have developed a detailed heat map that visually represents the shifts in house prices across different neighbourhoods in Chelmsford during this timeframe.
This five-year heat map is not just a visual tool; it’s a strategic asset that offers a nuanced view of our local housing market. It highlights the areas that have experienced different levels of growth in house prices.
Chelmsford’s housing market has been shaped by a variety of factors, including local developments and national economic shifts.
As a property agent with a comprehensive understanding of these influences, I am well-positioned to guide homeowners and investors through the complexities of the Chelmsford market.
If you’re looking to gain insights into the recent trends in Chelmsford housing market and how they might influence your property decisions, I am here to assist. Let’s discuss the implications of these trends on your property needs and how we can leverage this knowledge for your benefit.
Lets get started! Our valuations are based on our extensive knowledge of the whole of the market.
Get a valuation
Property Market
11 May 2026
If you are a homeowner or landlord in Chelmsford and th…
 Property Market
 Property Market