
 Community
12 Mar 2026
Chelmsford’s Homes and Their Hidden History
We often discuss the Chelmsford property market through…

Community
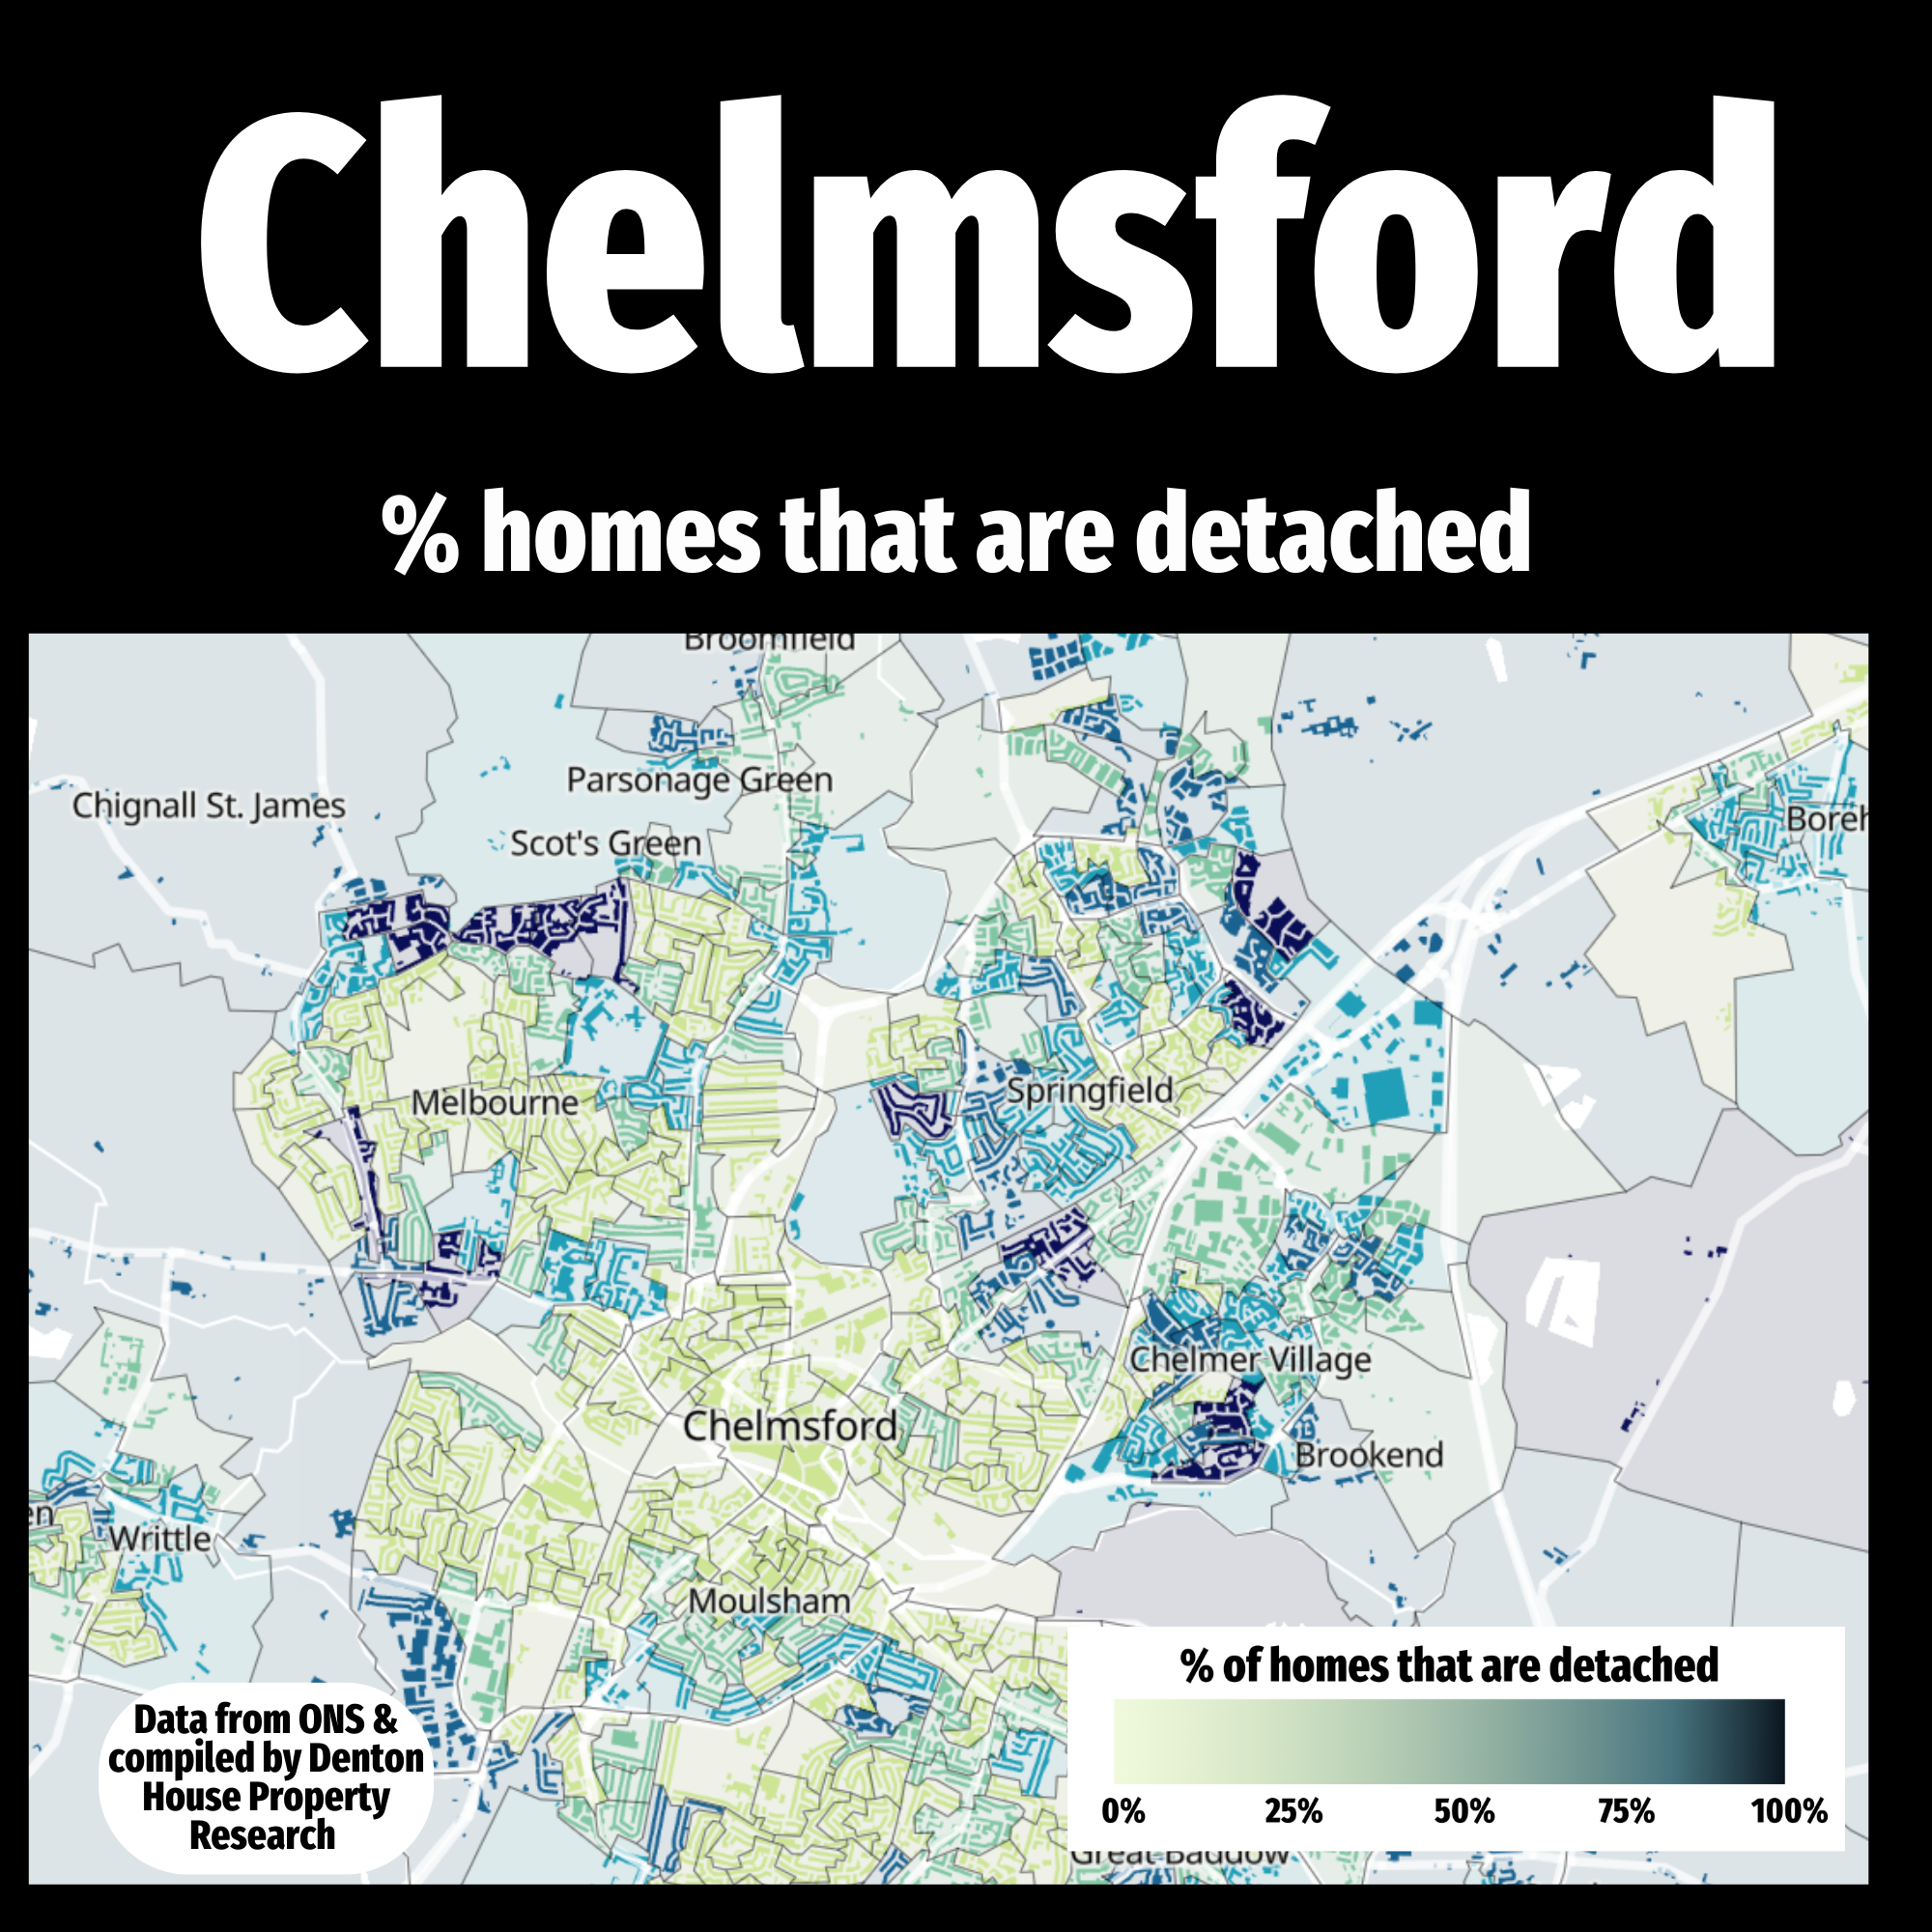
This map highlights the varying percentages of detached homes across different parts of Chelmsford.
The areas shown in darker shades represent neighbourhoods with a higher proportion of detached properties, while the lighter shades indicate areas with fewer detached homes. This is a great visual representation of how different parts of the town offer distinct property types, catering to a range of preferences and needs.
This week, I wanted to focus on where the detached homes are situated. In the coming months, I’ll be sharing similar insights into where other types of properties, such as semi-detached homes and flats, are located.
It’s always fascinating to see how the mix of property types of in the different parts of Chelmsford. If you’d like to stay updated on these insights and other local property market trends, follow us on social media for more interesting information about the Chelmsford property market!
Tel us your thoughts and if there are any surprises on the map in the comments.
Lets get started! Our valuations are based on our extensive knowledge of the whole of the market.
Get a valuation Community
 Community