
 Blog
Blog
01 Dec 2025
My Thoughts on the Budget for Chelmsford homeowners & landlords
The Autumn Budget delivered the expected changes to hou…

Landlord
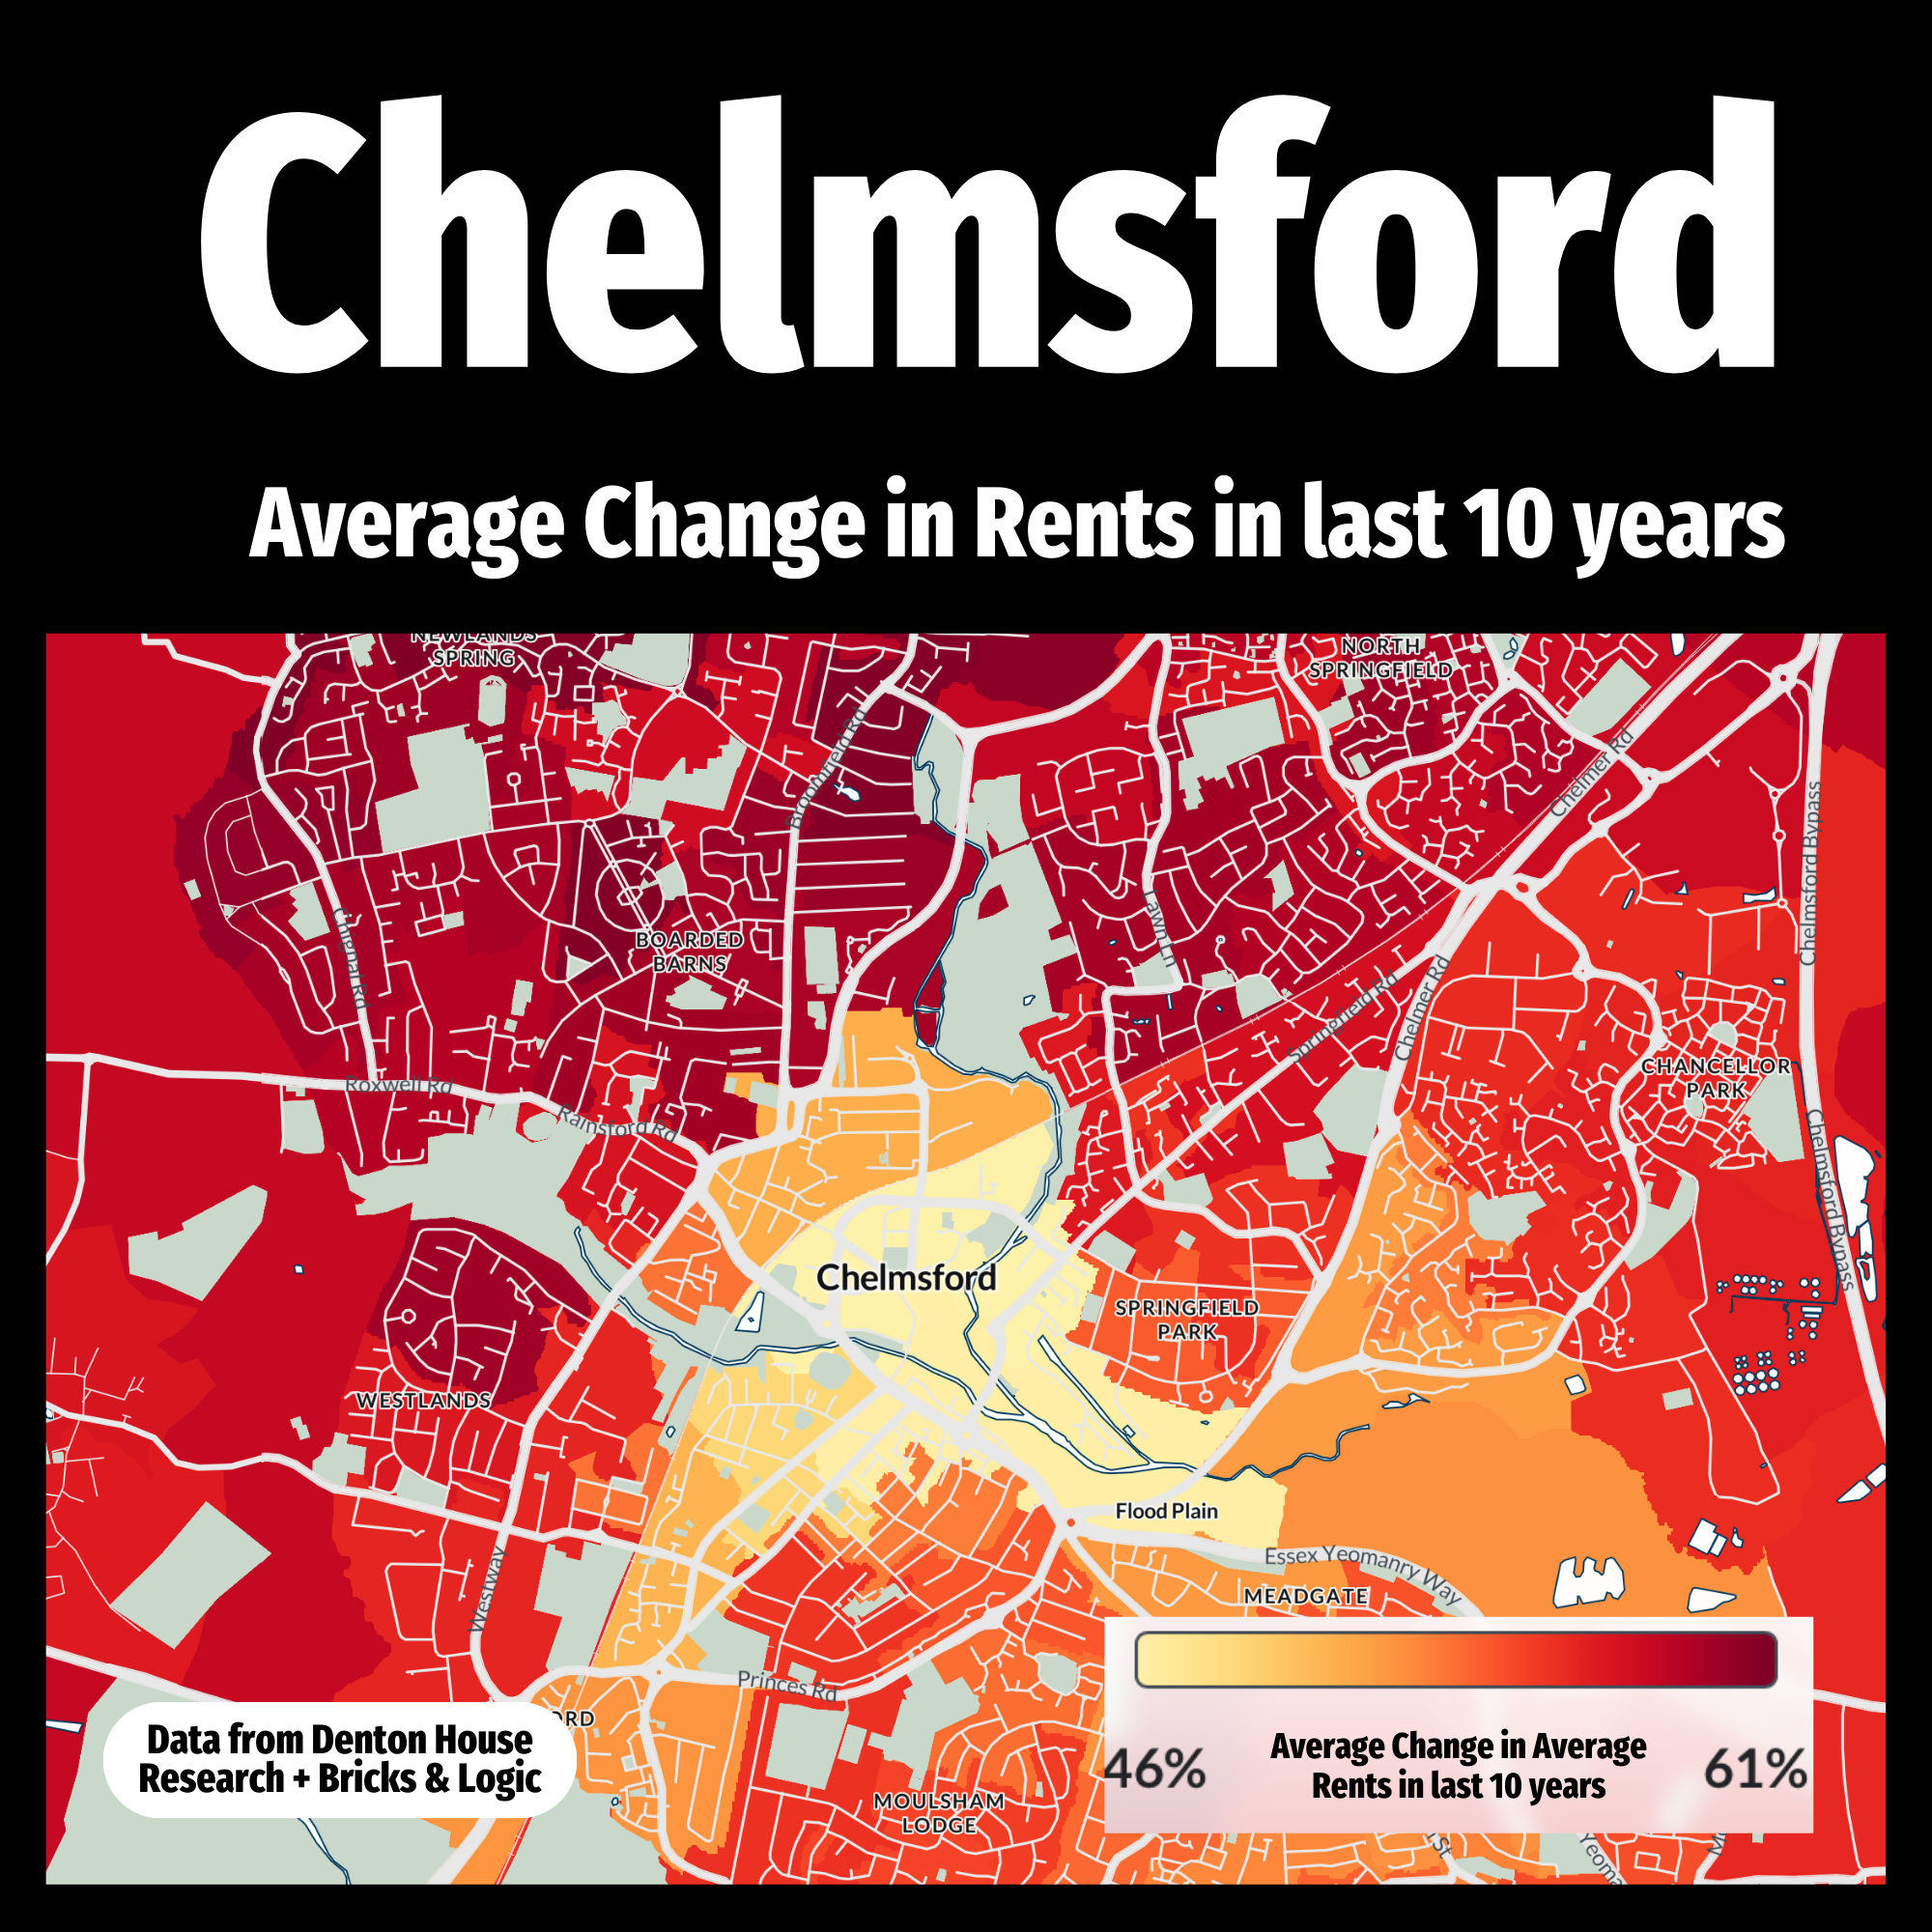
Over the past decade, the rental market in Chelmsford has experienced some fascinating changes. This heat map shows the average change in rents across Chelmsford over the last 10 years, with lighter colours representing areas of more modest rental growth, and the deeper reds highlighting locations where rents have risen most sharply.

These shifts are driven by a mixture of factors: tenant demand, availability of rental homes, local investment, and broader changes in the property market. As a Chelmsford landlord or investor, understanding these patterns is crucial — not only to maximise rental returns but also to make informed decisions when buying, selling, or restructuring your portfolio.
The local market continues to evolve, and there are opportunities for those who keep a close eye on the trends. If you’re considering investing further, adjusting your rents, or even selling a buy-to-let property, feel free to give us a call. Whether you want a general chat about the Chelmsford property market or need specific advice, we’d be delighted to help.
Lets get started! Our valuations are based on our extensive knowledge of the whole of the market.
Get a valuation Blog
Blog
 Landlord