
 Property Market
16 Feb 2026
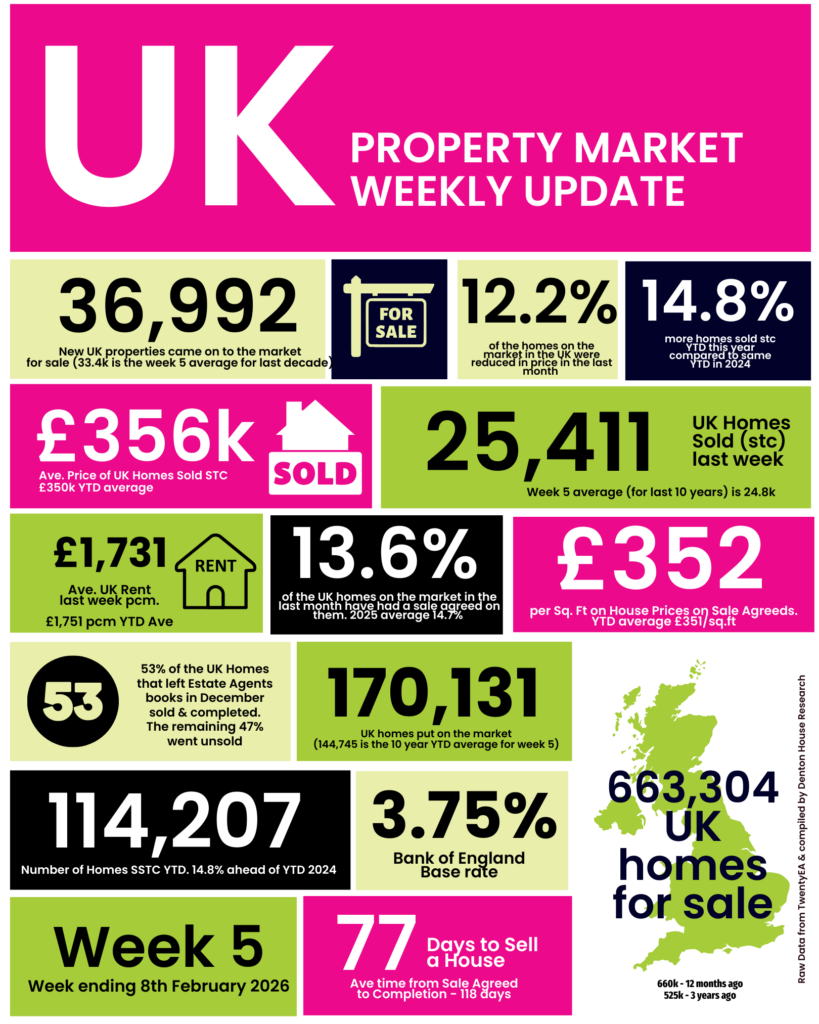
2026 Property Market. Week 5. Momentum with consequences.
If Week 4 told us the market was in motion, Week 5 conf…

Property Market
✅ New Listings
✅ Price Reductions
✅ Sales Agreed
✅ Price Diff between Listings & Sales
✅ Sell-Through Rate
✅ Fall-Throughs
✅ Net Sales
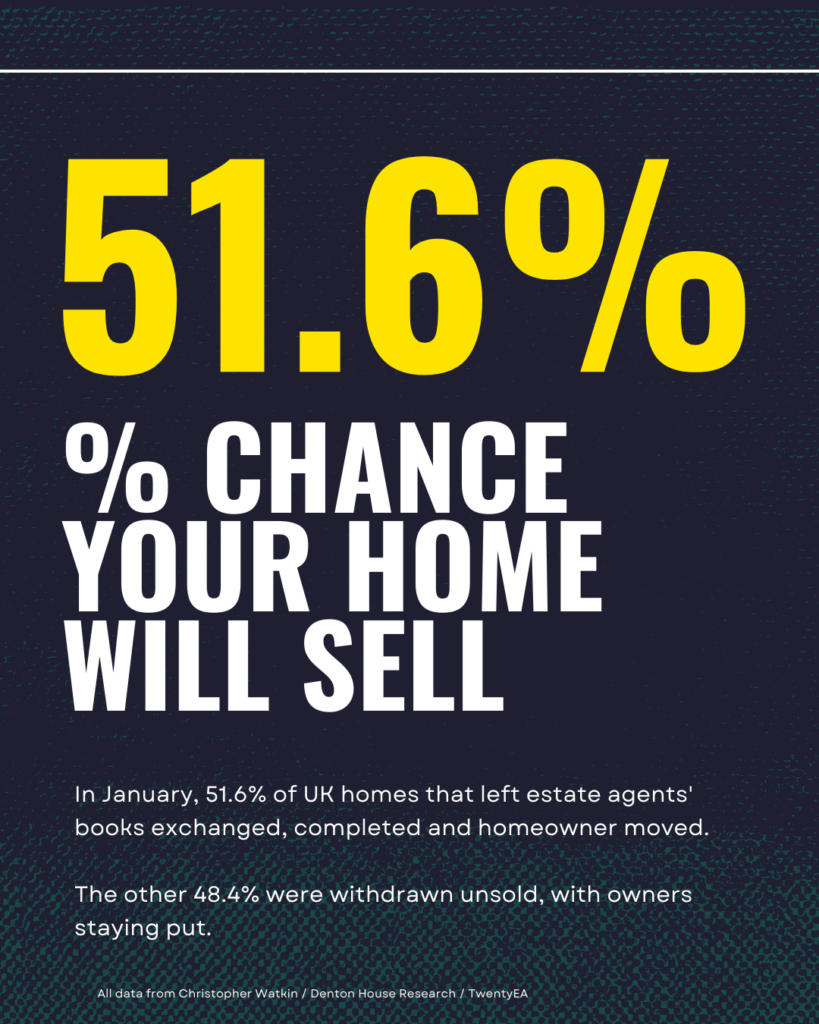
✅ Probability of Selling (% that Exchange vs withdrawal)
If you would like to chat about our local property market, feel free to drop us a line on 01245 835859 or email us on beth@charlesdavidcasson.co.uk.
Lets get started! Our valuations are based on our extensive knowledge of the whole of the market.
Get a valuation
Property Market
16 Feb 2026
If Week 4 told us the market was in motion, Week 5 conf…
 Property Market
 Property Market