
Property Market

UK Property Market Weekly Update

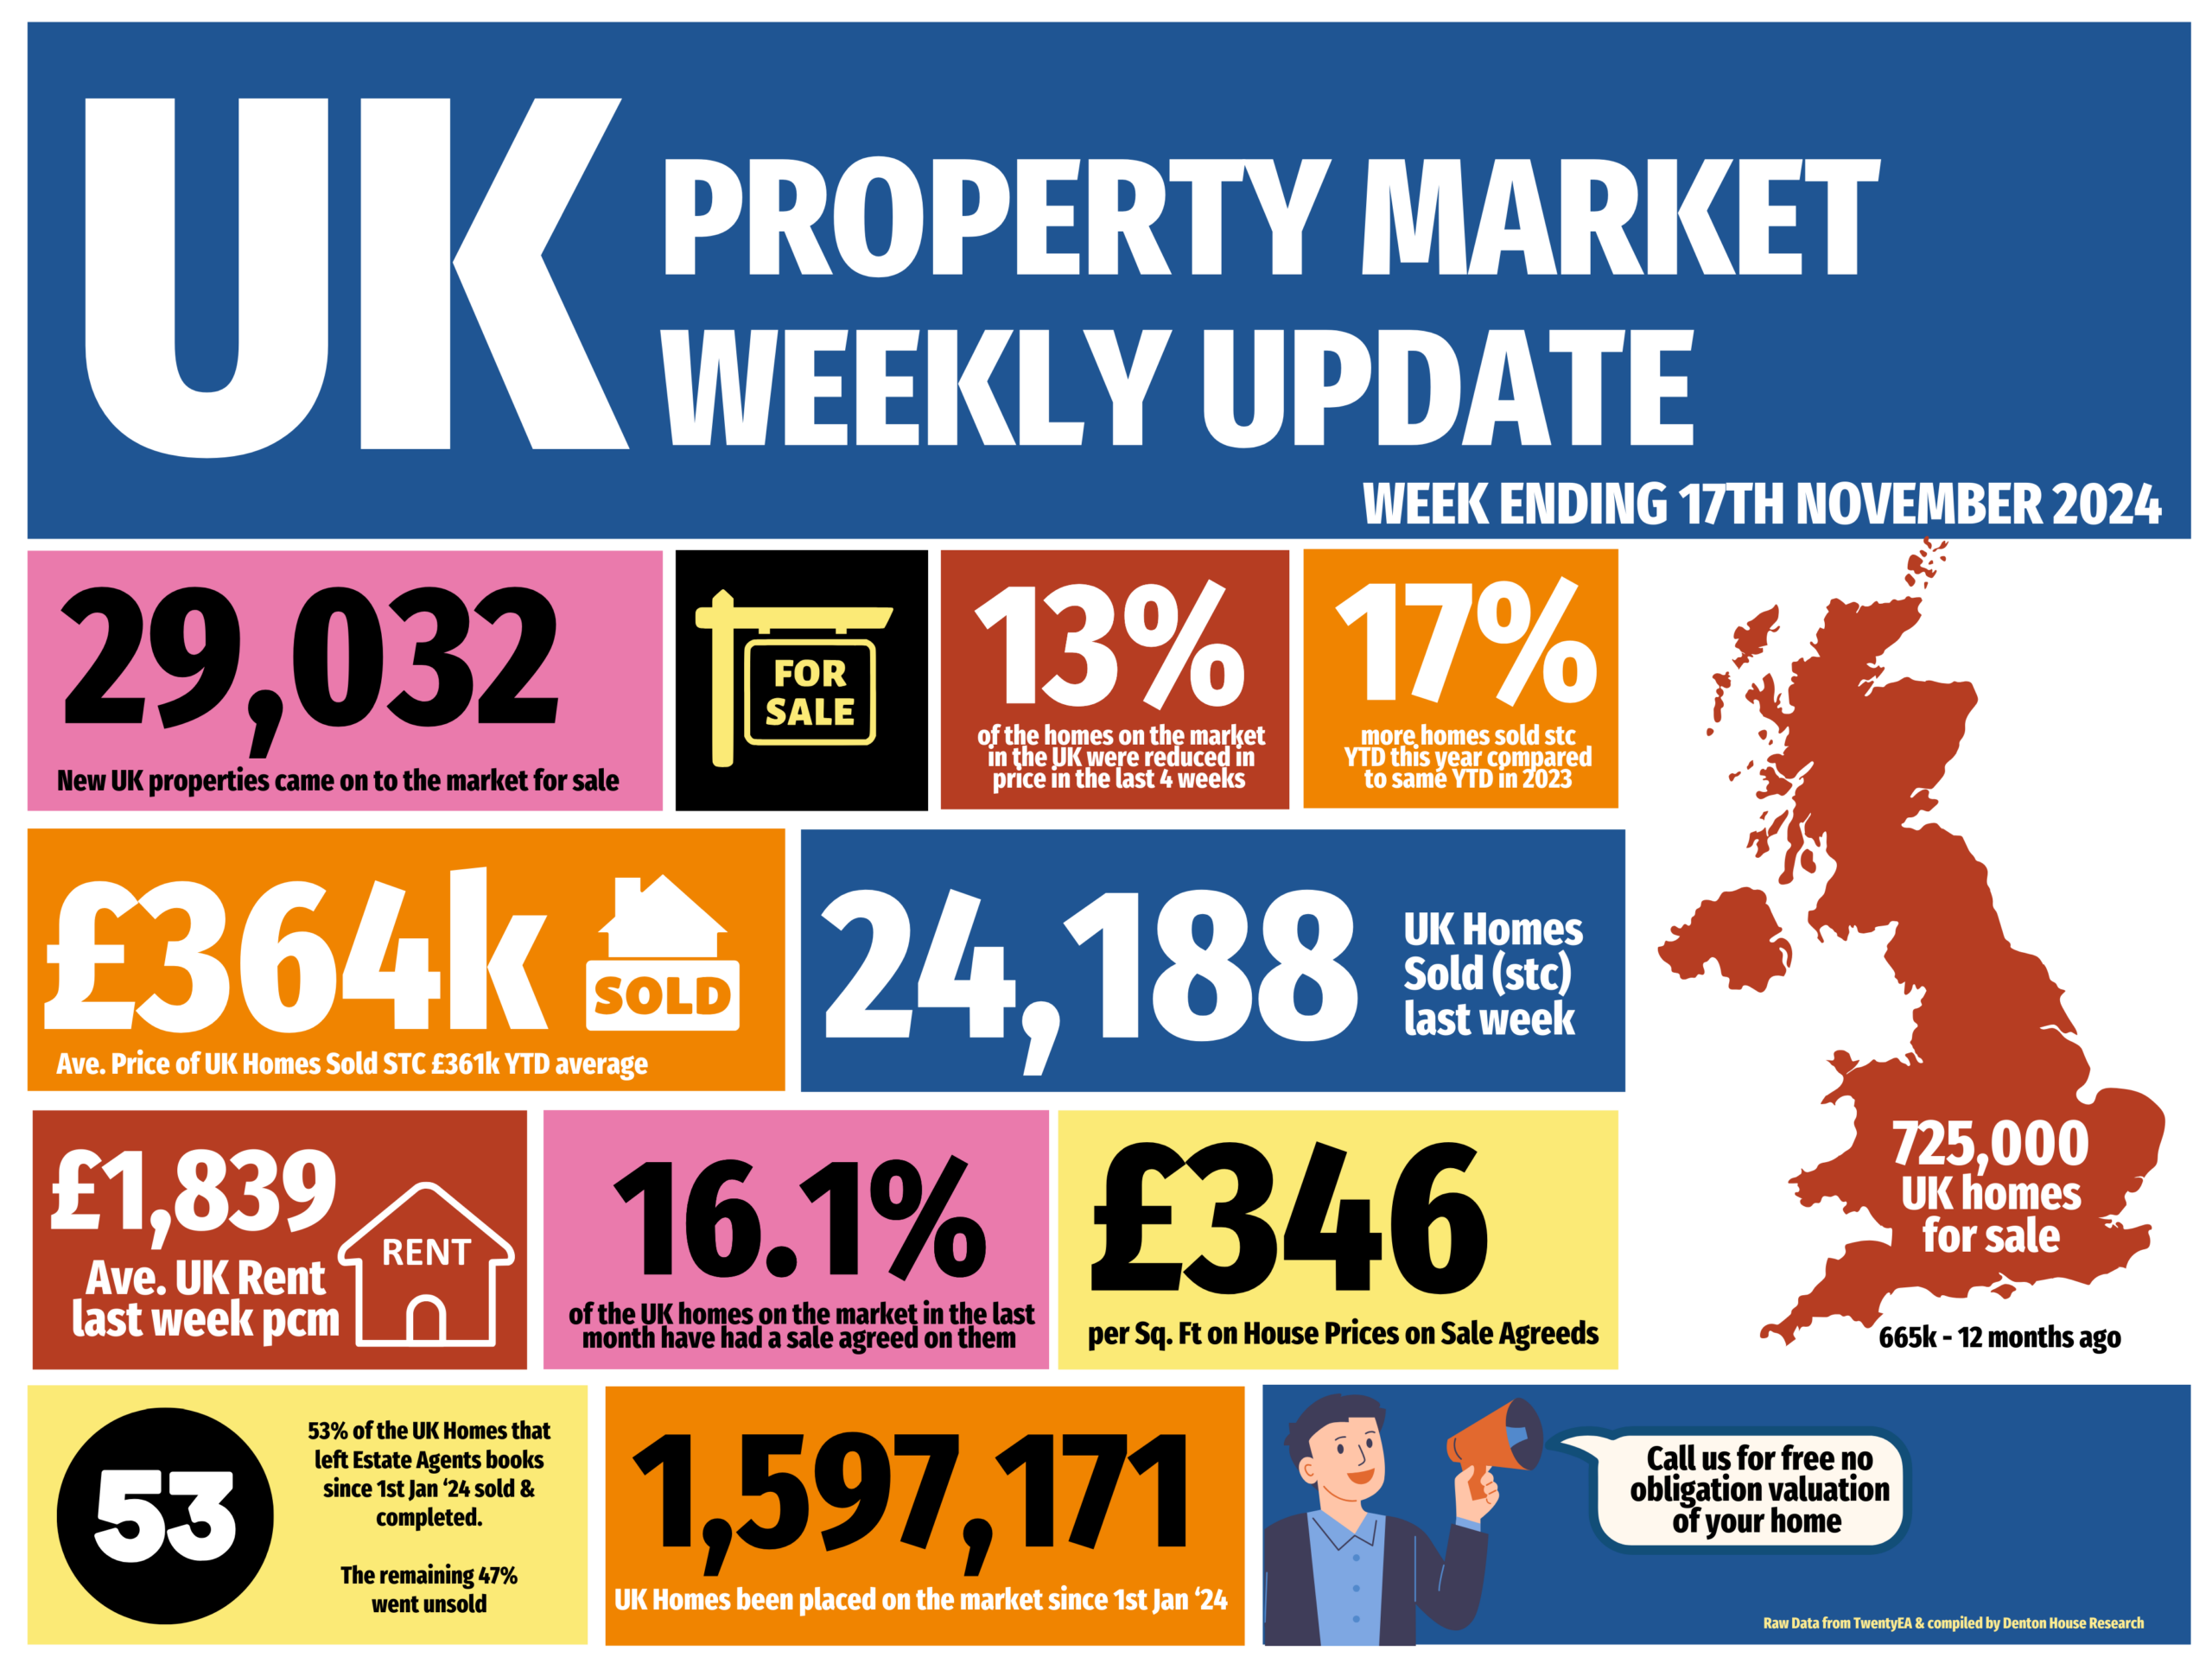
  • Listings (New properties coming on to the market) – 29k UK listings this week (week 46). YTD 2024, listings are 8% higher compared to 2023 YTD.


  • % of Resi Sales Stock being reduced (Monthly): 13% of Resi sales stock was reduced in the last month. 14% last month and long term 5 year average 10.6%.


  • Total Gross Sales – 24.2k UK homes sold stc this week (Week 46), slightly more than last week.  19.2% higher than the same standalone week (week 46) in 2023. Also, 8.5% higher than 2017/18/19 YTD levels & 14.9% higher than 2023 YTD levels.


  • Sale Thru rate (Monthly):UK Estate Agents sold 16.11% of their Resi sales stock in Oct ’24. Sept ‘ 24 was 14.79%. 2024 average is 15.86% & the 7 year long term average is 17.9% per month – yet don’t forget that was only in mid/late 20%’s in the crazy years of 20/21/22).


  • Sale fall-throughs–  For the week 46, Sale Fall Thrus (as a % of Gross sales Agreed) dropped significantly to 25% (down from 28.8% last week). The 7 year Long Term weekly Average is 24.2% and it was 40%+ in the two months following the Truss Budget in the Autumn of 2022. Agents lost 5.8% of their sales pipeline in Oct’24 (up from 5.6% in Sept ‘ 24).


  • Net Sales– 18.1k this week (17k last week). 18.2% higher than the same week 46 in 2023, 76% higher than the same week 46 in 2022 & still 17.3% higher YTD in 2024 compared to YTD 2023.


  • % of Homes exchanging vs homes unsold– Of the 1,358,587 UK homes that left UK Estate Agents books since the 1st Jan 2024, 728,138 of them (53.6%) exchanged & completed contracts (meaning the homeowner moved and the estate agent got paid). The remaining 630,449 (46.4%) were withdrawn off the market, unsold. In essence you a flip of the coin chance of actually selling, homeowners moving and the estate agent getting paid.


  • UK House Prices– As explained in the show, the £/sqft figure foretells and predicts the Land Registry 5 months in advance with an accuracy rating of 92%. Final October figures saw a slight jump in this important metric to £346/sq.ft. For comparison – Sept’s £339/sq.ft, August’s £338/sq.ft, and July at £341/sq.ft. This means house prices are slightly growing.


  • Resi Sales Stock on the Market (Monthly Stat) : 725k at end of October (up from 724k at end of Sept). For comparison, Oct ’23 – 664k, Oct ’22 – 523k,  Oct ’21 – 425k, Oct ’20 – 681k, Oct ’19 – 652k


  • Resi Sales Sold STC Pipeline(Units) (Monthly Stat): 505k at end of October. For comparison, Oct ’23 – 401k, Oct ’22 – 483k,  Oct ’21 – 528k, Oct ’20 – 548k, Oct ’19 – 372k

Value my property today

Lets get started! Our valuations are based on our extensive knowledge of the whole of the market.

Get a valuation

Related articles

Only 29.6% of Chelmsford Homes Have Sold More Than Once in Last 30 years Property Market

Only 29.6% of Chelmsford Homes Have Sold More Than Once in Last 30 years

The Chelmsford property market can often feel far more …

The Chelmsford Asking Price Trap Property Market

The Chelmsford Asking Price Trap

There is a quiet unspoken problem sitting inside the Ch…

What Does Sir Keir Starmer’s Resignation Mean for the UK Property Market? Property Market

What Does Sir Keir Starmer’s Resignation Mean for the UK Property Market?

Keir Starmer’s resignation will not automatically cau…